Page Not Found
Page not found. Your pixels are in another canvas.

A list of all the posts and pages found on the site. For you robots out there is an XML version available for digesting as well.
Page not found. Your pixels are in another canvas.
About me
This is a page not in th emain menu
Published:
This post will show up by default. To disable scheduling of future posts, edit config.yml and set future: false.
Published:
This is a sample blog post. Lorem ipsum I can’t remember the rest of lorem ipsum and don’t have an internet connection right now. Testing testing testing this blog post. Blog posts are cool.
Published:
This is a sample blog post. Lorem ipsum I can’t remember the rest of lorem ipsum and don’t have an internet connection right now. Testing testing testing this blog post. Blog posts are cool.
Published:
This is a sample blog post. Lorem ipsum I can’t remember the rest of lorem ipsum and don’t have an internet connection right now. Testing testing testing this blog post. Blog posts are cool.
Published:
This is a sample blog post. Lorem ipsum I can’t remember the rest of lorem ipsum and don’t have an internet connection right now. Testing testing testing this blog post. Blog posts are cool.
Project for DIY imaging platform. 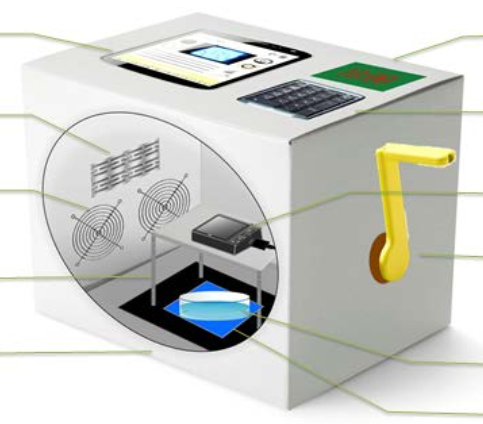
This work is done together with Han N. Lim 
This work is done together with Peter Sudmant 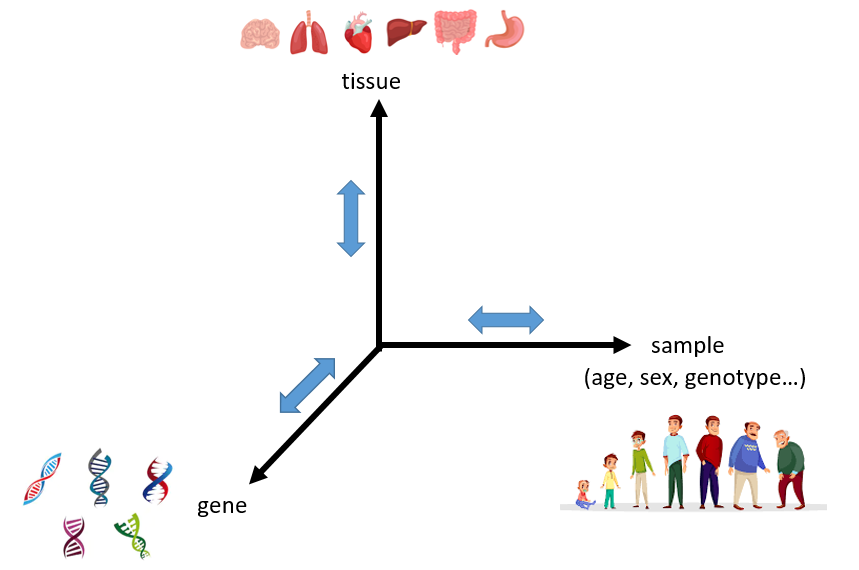
Project for Deep Reinforcement Learning 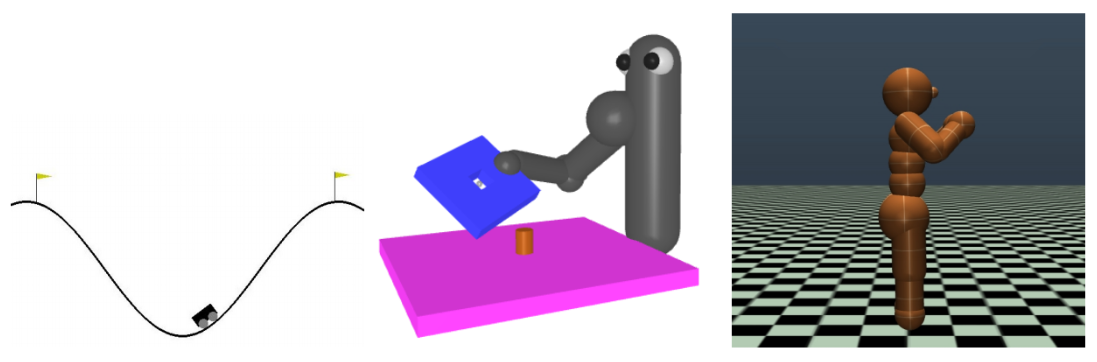
Project for Machine Learning 
Project for TensorFlow. 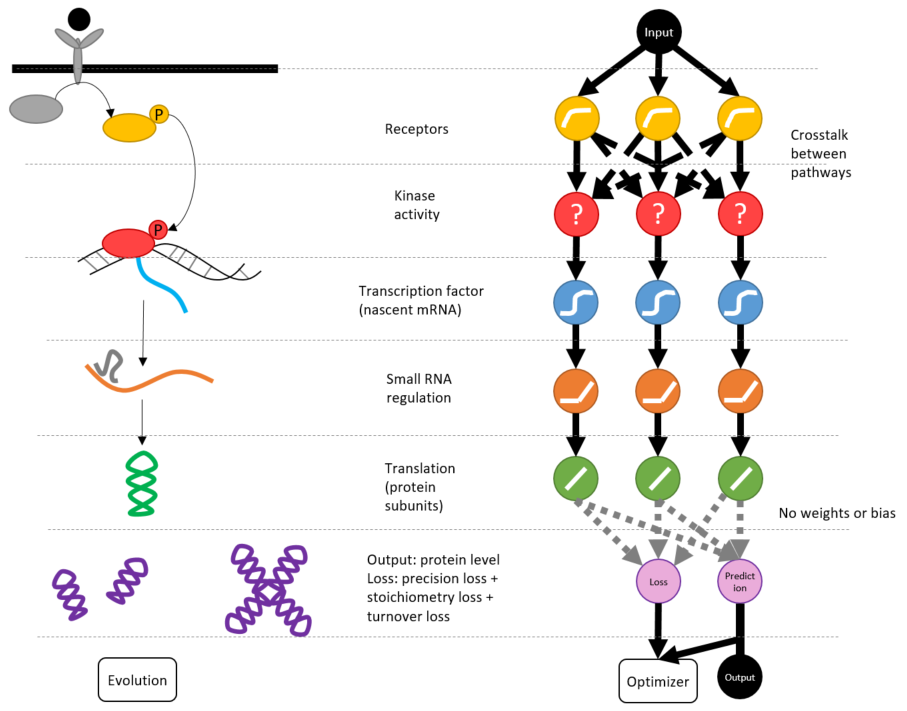
This work is done at Roche Sequencing Solutions, Inc. 
This work is done at Roche Sequencing Solutions, Inc. 
Published in Biology open, 2016

Quantifying the localization of molecules with respect to other molecules, cell structures and intracellular regions is essential to understanding their regulation and actions. However, measuring localization from microscopy images is often difficult with existing metrics. Here, we evaluate a metric for quantifying localization termed the threshold overlap score (TOS), and show it is simple to calculate, easy to interpret, able to be used to systematically characterize localization patterns, and generally applicable. TOS is calculated by: (i) measuring the overlap of pixels that are above the intensity thresholds for two signals; (ii) determining whether the overlap is more, less, or the same as expected by chance, i.e. colocalization, anti-colocalization, or non-colocalization; and (iii) rescaling to allow comparison at different thresholds. The above is repeated at multiple threshold combinations to generate a TOS matrix to systematically characterize the relationship between localization and signal intensities. TOS matrices were used to identify and distinguish localization patterns of different proteins in various simulations, cell types and organisms with greater specificity and sensitivity than common metrics. For all the above reasons, TOS is an excellent first line metric, particularly for cells with mixed localization patterns.
Recommended citation: Sheng, H., Stauffer, W., & Lim, H. N. (2016). "Systematic and general method for quantifying localization in microscopy images." Biology open, 5(12), 1882-1893. https://bio.biologists.org/content/biolopen/5/12/1882.full.pdf?with-ds=yes
Published in Nucleic acids research, 2017

Bacterial small RNAs (sRNAs) regulate protein production by binding to mRNAs and altering their translation and degradation. sRNAs are smaller than most mRNAs but larger than many proteins. Therefore it is uncertain whether sRNAs can enter the nucleoid to target nascent mRNAs. Here, we investigate the intracellular localization of sRNAs transcribed from plasmids in Escherichia coli using RNA fluorescent in-situ hybridization. We found that sRNAs (GlmZ, OxyS, RyhB and SgrS) have equal preference for the nucleoid and cytoplasm, and no preferential localization at the cell membrane. We show using the gfp mRNA (encoding green fluorescent protein) that non-sRNAs can be engineered to have different proportions of nucleoid and cytoplasmic localization by altering their length and/or translation. The same localization as sRNAs was achieved by decreasing gfp mRNA length and translation, which suggests that sRNAs and other RNAs may enter the densely packed DNA of the nucleoid if they are sufficiently small. We also found that the Hfq protein, which binds sRNAs, minimally affects sRNA localization. Important implications of our findings for engineering synthetic circuits are: (i) sRNAs can potentially bind nascent mRNAs in the nucleoid, and (ii) localization patterns and distribution volumes of sRNAs can differ from some larger RNAs.
Recommended citation: Sheng, H., Stauffer, W. T., Hussein, R., Lin, C., & Lim, H. N. (2017). "Nucleoid and cytoplasmic localization of small RNAs in Escherichia coli." Nucleic acids research, 45(5), 2919-2934. https://academic.oup.com/nar/article-pdf/45/5/2919/16941952/gkx023.pdf
Published in Scientific reports, 2018
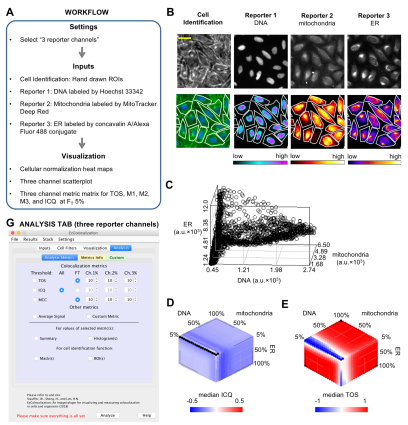
Insight into the function and regulation of biological molecules can often be obtained by determining which cell structures and other molecules they localize with (i.e. colocalization). Here we describe an open source plugin for ImageJ called EzColocalization to visualize and measure colocalization in microscopy images. EzColocalization is designed to be easy to use and customize for researchers with minimal experience in quantitative microscopy and computer programming. Features of EzColocalization include: (i) tools to select individual cells and organisms from images; (ii) filters to select specific types of cells and organisms based on physical parameters and signal intensity; (iii) heat maps and scatterplots to visualize the localization patterns of reporters; (iv) multiple metrics to measure colocalization for two or three reporters; (v) metric matrices to systematically measure colocalization at multiple combinations of signal intensity thresholds; and (vi) data tables that provide detailed information on each cell in a sample. These features make EzColocalization well-suited for experiments with low reporter signal, complex patterns of localization, and heterogeneous populations of cells and organisms.
Recommended citation: Stauffer, W., Sheng, H., & Lim, H. N. (2018). "EzColocalization: An ImageJ plugin for visualizing and measuring colocalization in cells and organisms." Scientific reports, 8(1), 15764. http://academicpages.github.io/files/paper3.pdf
Published in bioRxiv, 2019
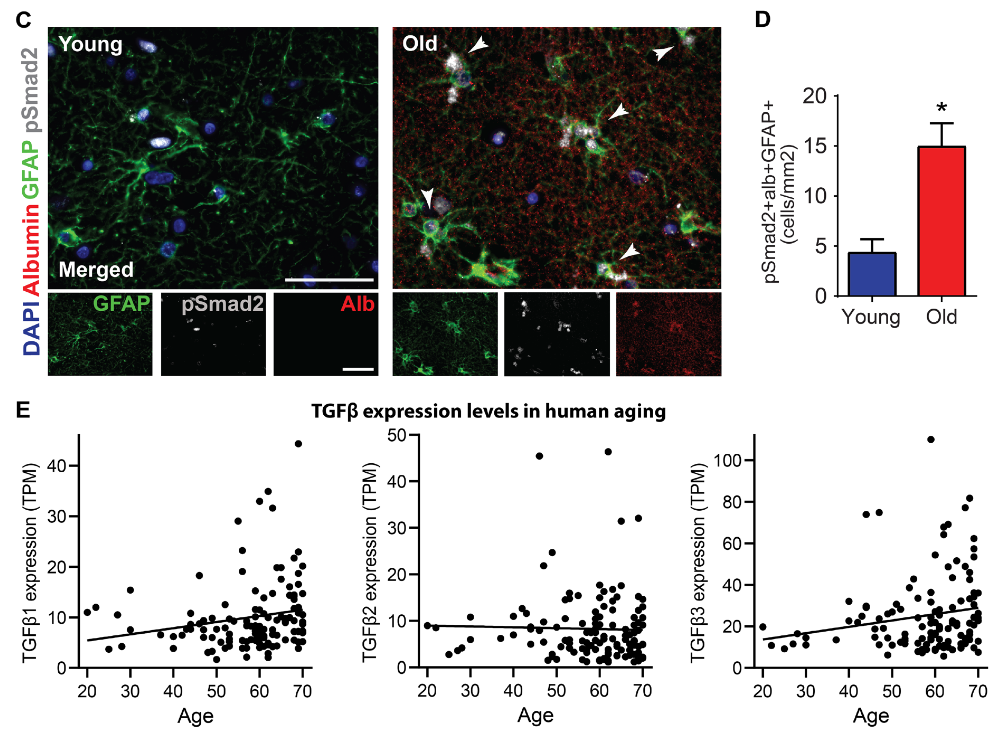
Quantifying the localization of molecules with respect to other molecules, cell structures and intracellular regions is essential to understanding their regulation and actions. However, measuring localization from microscopy images is often difficult with existing metrics. Here, we evaluate a metric for quantifying localization termed the threshold overlap score (TOS), and show it is simple to calculate, easy to interpret, able to be used to systematically characterize localization patterns, and generally applicable. TOS is calculated by: (i) measuring the overlap of pixels that are above the intensity thresholds for two signals; (ii) determining whether the overlap is more, less, or the same as expected by chance, i.e. colocalization, anti-colocalization, or non-colocalization; and (iii) rescaling to allow comparison at different thresholds. The above is repeated at multiple threshold combinations to generate a TOS matrix to systematically characterize the relationship between localization and signal intensities. TOS matrices were used to identify and distinguish localization patterns of different proteins in various simulations, cell types and organisms with greater specificity and sensitivity than common metrics. For all the above reasons, TOS is an excellent first line metric, particularly for cells with mixed localization patterns.
Recommended citation: Senatorov, V. V., Friedman, A. R., Milikovsky, D. Z., Ofer, J., Saar-Ashkenazy, R., Charbash, A., ... H. Sheng, ... & Ramsay, H. J. (2016). "Systematic and general method for quantifying localization in microscopy images." bioRxiv, 537431. https://www.biorxiv.org/content/10.1101/537431v1.abstract
Published in Frontiers in Computational Neuroscience, 2020
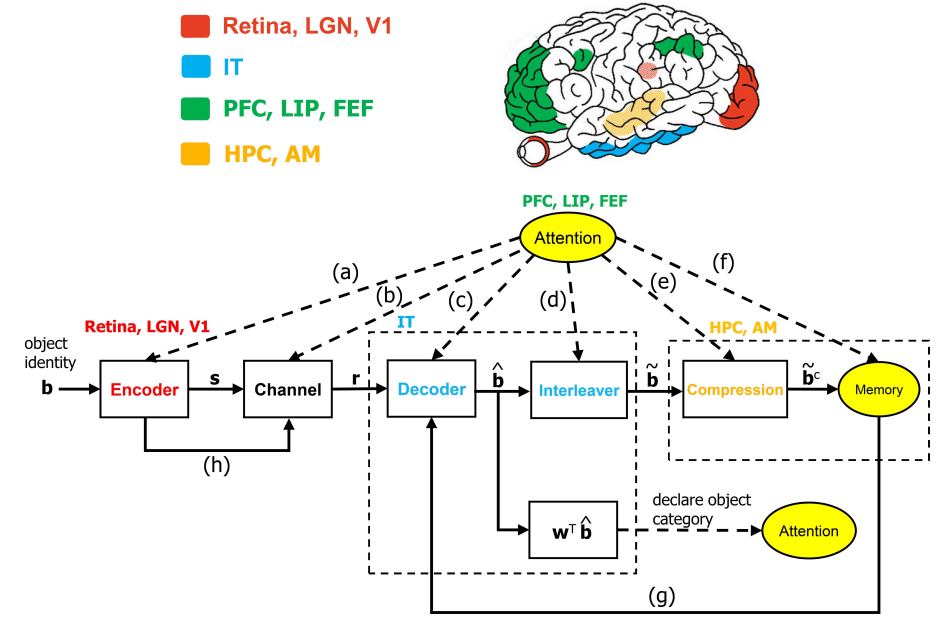
The ventral visual stream (VVS) is a fundamental pathway involved in visual object identification and recognition. In this work, we present a hypothesis of a sequence of computations performed by the VVS during object recognition. The operations performed by the inferior temporal (IT) cortex are represented as not being akin to a neural-network, but rather in-line with a dynamic inference instantiation of the untangling notion. The presentation draws upon a technique for dynamic maximum a posteriori probability (MAP) sequence estimation based on the Viterbi algorithm. Simulation results are presented to show that the decoding portion of the architecture that is associated with the IT can effectively untangle object identity when presented with synthetic data. More importantly, we take a step forward in visual neuroscience by presenting a framework for an inference-based approach that is biologically inspired via attributes implicated in primate object recognition. The analysis will provide insight in explaining the exceptional proficiency of the VVS.
Recommended citation: Sorooshyari, S. K., Sheng, H., & Poor, H. V. (2020). Object Recognition at Higher Regions of the Ventral Visual Stream via Dynamic Inference. Frontiers in computational neuroscience, 14, 46.
Recommended citation: Sorooshyari, S. K., Sheng, H., & Poor, H. V. (2020). Object Recognition at Higher Regions of the Ventral Visual Stream via Dynamic Inference. Frontiers in computational neuroscience, 14, 46. https://www.frontiersin.org/articles/10.3389/fncom.2020.00046/pdf
Undergraduate course, University of California at Berkeley, Department of Integrative Biology, 2014-2019

The primary job for instructors in Bio 1B is to lead the laboratory classes. These labs currently cover three major sections: Evolution, Ecology, and Organismal Diversity. Exercises include investigations into population genetics, phylogenetic relationships, macroevolution, predator/prey interactions, competition, bioindicators, and structure and function of organisms. BIO 1B is a gateway course to the major field of Integrative Biology that consists of three one-hour lectures and one four- hour combined discussion and lab each week. The class has 48 sections with a maximum of 18 students in each section. Lecturers will be required to lead one discussion and lab per week, create quizzes, grade assignments, attend a Friday instructional meeting, be familiar with lecture, proctor exams, hold office hours and complete other instructional duties as assigned. Senior lecturers mentor new hires and Graduate Student Instructors (GSIs).
Undergraduate Course, University of California at Berkeley, Department of Integrative Biology, 2015
IB115 is an upper division undergraduate course to teach undergraduate and graduate students, from diverse biological and physical sciences backgrounds, how to create simple mathematical models to better understanding biological systems. The instructor is responsible for running the computer laboratory classes, grade the exams, and help students with their final project.